
Chapter Recaps: my notes to chapters of the financial planning coursework material through New York University’s CFP® Program (in conjunction with Dalton Education).
Chapter 3: Financial Planning Approaches: Analysis and Recommendations
Note: This chapter focuses on the third and fourth steps of the FP process: analyzing and evaluating the client’s financial status, and developing and presenting FP recommendations.
- Introduction
- Goals = more broad (example: enough assets to retire).
- Objectives = more narrow, defined/able to measure (example: $1M in investment assets by age 45).
- Reasonable Assumptions
- Advisor must work with client to determine reasonable assumptions – especially when projections used to evaluate whether a goal can be achieved.
- These assumptions include: adequate emergency fund; total monthly non-discretionary cash flows; appropriate debt ratios; personal, property, and liability risks and ways to cover; retirement benchmarks to be used (retirement age, life expectancy, inflation, income tax rate, etc.); education assumptions (education inflation rate); lump-funding goal amount assumptions.
- Advisor must work with client to determine reasonable assumptions – especially when projections used to evaluate whether a goal can be achieved.
- The Analysis
- After the first 2 steps of FP process complete (establish client relationship and gather data), agreed-upon assumptions are used in various FP approaches to generate plan recommendations.
- The Approaches to Financial Planning Analysis and Recommendations
- There are a wide variety of approaches – each offer a slightly different perspective of the collected data. Each briefly:
- Life cycle approach:
- Quick data collection; planner gets a brief overview to facilitate a focused first conversation. Usually used early in engagement.
- Pie chart approach:
- Utilizes visual representation of how client allocates financial resources.
- Usually used after prepping financial statements.
- Example: balance sheet pie chart shows relative size of liabilities and net worth to total assets.
- Financial statement and ratio analysis approach:
- Helps create a financial snapshot at a point in time.
- Ratio analysis shines light on strengths, weaknesses, and deficiencies when compared to benchmark metrics.
- Usually follows Pie chart approach.
- Two-step/three-panel approach:
- A step-by-step approach comparing client to benchmarks.
- Relatively thorough approach and a manageable approach.
- Emphasizes risk management, avoiding financial dependence, and promotes savings and investing (to obtain financial independence).
- The present value of goals approach:
- Looks at each ST, MT, and LT goal, determines their present values, and adds together as an overall obligation.
- Treats this obligation as an annuity compared to current annual savings amount to determine savings adequacy.
- The metrics approach:
- Uses quantitative benchmarks as rules of thumb to compare where client’s financial profile should be.
- Cash flow approach:
- An income statement approach utilizing the three-panel approach and as if client was purchasing the recommendations. Drives down discretionary cash flow and looks at ways (positive CF’s or asset sales) to finance the recommendations.
- Strategic approach:
- Uses a “mission, goal, and objective approach” looking at internal and external environment.
- Can be used with other approaches.
- Life cycle approach:
- Using just one approach likely not enough. Using all creates redundancy. As gain experience, planners combine approaches to tailor planner preferences and client needs.
- There are a wide variety of approaches – each offer a slightly different perspective of the collected data. Each briefly:
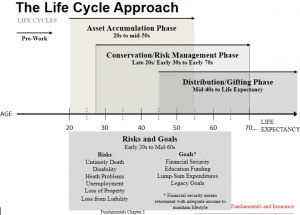
- The Life Cycle Approach
- Planner gathers: client/spouse ages, marital status, number/ages of children/grandchildren, family income per contributor, family net worth, employment status.
- A broad overview of client financial profile; helps focus initial discussion. Gives planner ~60-75% perspective of client’s risks and goals.
- Age of spouses may indicate client’s phase of life:

-
- Asset accumulation phase – usually early 20’s until late 50’s when discretionary CF for investing is low and debt-to-net worth is high.
- Conservation (risk management) phase – usually beings late 20’s until early 70’s. CF, assets, and NW have increased and debts somewhat decreased.
- Distribution (gifting) phase – usually starts mid 40’s/early 50’s until end of life. High CF, low debt, and higher NW.
- Possible to be in 2 or all 3 phases at the same time.
- Again, good starting point, but doesn’t have the specifics for planner to create a detailed, comp. plan.
- The Pie Chart Approach
- Pie Chart Approach Overview:
- Benefits: helps clients visualize the relative size of financial variables.
- Statements are prepared first. Then pie charts for income statement (also referred to as CF statement) and balance sheet.
- Usually uses percentages, but can also use dollar amounts.
- Income Statement Pie Chart:
- Planner calculates client’s expenses from income statement as a proportion of client’s gross pay and depicts them in a pie chart.
- Expenses can include Taxes, Savings, Insurance, Housing Costs, Discretionary, and Other Living Expenses).
- Helpful to analyze against client’s other characteristics (age, gross pay, risks, etc.).
- Shortcomings: difficult to depict negative CF in pie charts.
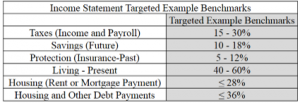
- Benchmarks (General as these can vary widely among individuals):
- Benefits: Comparing to Targeted Example Benchmark percentages can help facilitate discussion regarding strengths and weaknesses. If benchmark pie chart agreed to, then can establish step-by-step plan to get there.
- Planner calculates client’s expenses from income statement as a proportion of client’s gross pay and depicts them in a pie chart.
- Balance Sheet Pie Chart
- Used to depict percentage of total assets are various B/S accounts: cash, investment assets, personal use assets, current & LT liabilities, and NW.
- Two pie charts used: one for the Asset side and other for Liabilities and NW side.
- Asset side = cash & equivalents, investment assets, and personal use assets.
- Cash & equivalents percentage is related to the ND cash outflows on IS.
- Investment assets percentage related to age of the client and gross pay.
- Liabilities side = ST and LT and NW.
- If NW is negative, then technically insolvent and pie charts for the B/S might be unreliable.
- Asset side = cash & equivalents, investment assets, and personal use assets.
- Benchmark:
- Planner should look at client age, gross pay, and ND CF to determine benchmark B/S pie chart.
- Typical benchmark goals by age range for a client’s B/S:
20s – 30s 40s – 50s 50s – 70s Assets Cash & Cash Equivalents 5 – 20% 5 – 20% 5 – 20% Investment Assets 0 – 30% 30 – 60% 60 – 70% Personal Use Assets 25 – 60% 25 – 60% 15 – 30% Liabilities Current Liabilities 10 – 20% 10 – 20% 0 – 10% Long-Term Liabilities 40 – 72% 16 – 48% 8 – 24% Net Worth Net Worth 8 – 50% 32 – 74% 66 – 82%
- Pie Chart Approach Overview:
Like Life Cycle approach, Pie Chart approach generally used in preliminary stages of engagement and not used for detailed FP analysis.
The Financial Statement and Ratio Analysis Approach
Overall approach: uses financial ratios to clarify & reveal true financial situation of client.
Four types of ratios:
Liquidity: measure ability to meet ST obligations.
Debt ratios: how well client is managing debt.
Financial security goals: show client progress towards obtaining LT financial security goals.
Performance ratios: adequacy of returns on investments given risks taken.
Liquidity Ratios:
Most common: Emergency Fund (EF) ratio and Current Ratio.
Emergency Fund Ratio:
Emergency Fund Ratio = (Cash & CE) / Monthly ND CF’s.
- Determines number of months client can cover ND CF’s with current liquidity.
- Covers risks such as employment loss, injury, or other unexpected occurrences.
- Benchmark is 3 to 6 months of ND CF coverage, though very dependent on client’s situation and job market at time of emergency. Thus, benchmark should be used cautiously and revised per client and economic climate.
- Example: a tenured professor may be at a lower risk for unemployment.
- Disability policy elimination period should also be considered when determining an EF ratio target.
- Definitions:
- Discretionary CF’s = can be avoided if income is lost.
- Examples: entertainment, vacations.
- Non-Discretionary = generally fixed monthly obligations & expenses that have to be met regardless of income loss.
- Examples: Mortgage loan, auto loan, Insurance, Food, Auto maintenance, clothing, utilities.
- Classifying some monthly CF’s can be either, depending on client (tithes may be non-discretionary, for example).
- Usually income and payroll taxes because the typical use of EF is loss of employment income.
- Discretionary CF’s = can be avoided if income is lost.
- Benchmark is 3 to 6 months of ND CF coverage, though very dependent on client’s situation and job market at time of emergency. Thus, benchmark should be used cautiously and revised per client and economic climate.
- Covers risks such as employment loss, injury, or other unexpected occurrences.
- Current Ratio:
- Current Ratio = (Cash & CE) / Current Liabilities
- Gives idea of ability to meet ST obligations.
- CL = paid within the next year.
- Larger CR = more liquidity.
- Though, most pay CL and related interest from current income and not cash & ce, so a CR < 1 may be fine.
- Can modify by adding Discretionary CF to the numerator.
- Larger CR = more liquidity.
- CL = paid within the next year.
- Gives idea of ability to meet ST obligations.
- Current Ratio = (Cash & CE) / Current Liabilities
- Debt Ratios:
- Four kinds: Housing Ratio 1 (Basic), Housing Ratio 2 (Broad), Debt to Total Assets Ratio, and Net Worth to Total Assets Ratio.
- Housing Ratio 1 (Basic):
- Housing Ratio 1 = Housing Costs / Gross Pay <= 28%
- Housing Costs = principal pmt’s on mortgage (or rent), interest, homeowners insurance, property taxes, and any association dues.
- Purpose: obtain percentage of gross pay allocated toward basic housing.
- Not included: utilities, lawn care, maintenance, etc.
- Benchmark: 28% or less is necessary for first-time home buyer to qualify for a conforming (best) rate mortgage.
- Used traditionally by mortgage lenders to issue confirming (best) rate mortgages.
- Ratio should decline to ~5% (though not in high-property tax states like Texas) at retirement (when mortgage is assumed to be paid off), and only taxes, association dues, and insurance expenses continue.
- Housing Ratio 2 (Broad):
- Housing Ratio 2 combines basic housing cost (HR1) with ALL other monthly DEBT payments (auto loans, student loans, bank loans, revolving consumer loans, credit card pymt’s, and any other recrurring debt payments).
- Benchmark is <= 36% of gross pay.
- Special circumstance: if client only making minimum credit payments, planner should calculate a pymt using the IR on card that would retire CC ebt in 36 to 60 months to avoid underestimating the relevant ratio. CC statements now are required to disclose this comparison (saves planner time).
- Debt to Total Assets Ratio:
- Debt to Total Assets Ratio = Total Debt / Total Assets
- Purpose: shows what percentage of assets owned are financed by creditors.
- Benchmarks: commonly as high as 80% for young people and as low as 10% or less for people near retirement age.
- Net Worth to Total Assets Ratio:
- Net Worth to Total Assets Ratio = Net Worth / Total Assets.
- Purpose: shows percentage of total assets owned or paid for by client. (flip-side to Debt to Total Assets ratio).
- Purpose: obtain percentage of gross pay allocated toward basic housing.
- Housing Costs = principal pmt’s on mortgage (or rent), interest, homeowners insurance, property taxes, and any association dues.
- Financial Security Goals Ratios:
- Purpose: help assess client progress towards LT goals.
- Two most common ratios: Savings Rate and Investment Assets to Gross Pay Ratio.
- Savings Rate:
- Savings Rate = (Savings + Employer Match) / Gross Pay
- Benchmark: at least 10-13%, though depends on client goals.
- For 25 yo with only LT goal is retirement, then 10-13% excluding Social Security contributions. If client has multiple LT goals, need to increase the rate.
- Note: dividends, interest, and capital gains (portfolio income) not counted because already included in rate of return.
- Investment Assets to Gross Pay Ratio (IA to GP):
- Overview:
- Combination of Savings Rate ratio and this ratio gives a better understanding of current progress towards achieving retirement goal.
- This ratio used when clients are saving 10%-13% of gross pay.
- All investment assets are considered (including cash & CE, and education savings).
- Investment Assets to Gross Pay Ratio:
- [(Investment Assets)+(Cash and CE)] / Gross Pay
- IA does not include most homes and various collectibles.
- [(Investment Assets)+(Cash and CE)] / Gross Pay
- Benchmark: depends on age and reliable for a wide range of income levels.
-
Age Ratio 25 0.2:1 30 0.6 to 0.8:1 35 1.6 to 1.8:1 45 3 to 4:1 55 8 to 10:1 65 16 to 20:1 - Example: Client aged 35 should have 1.6 to 1.8 times his annual gross pay in investment assets as savings for retirement.
- For incorporating a defined benefit plan pension or employer-provided pension plan:
- Two options:
- Calculate the PV of all pension benefits and include on the client’s B/S under investment assets.
- Or, decrease wage replacement needs amount at retirement by the expected pension income benefit at the time and then recalculate the adjusted needs for the amount of savings needed to drive the new wage replacement ratios.
- Notes:
- Only adjust when reasonable certainty client will receive the benefit.
- First option is preferred as only includes PV of vested benefits w/out assuming future benefits or if client will stick with employer until retirement.
- Two options:
-
- Special circumstances:
- Context of ratio is important. If person has a debt-free residence, but low IA to GP ratio, might be okay if has a current and future increasing savings rate because the IA to GP ratio should grow quickly.
- Overview:
- Savings Rate:
- Performance Ratios:
- Three performance ratios: Return on Investments, Return on Assets, and Return on Net Worth:
- Return on Investments (ROI):
- Measures: rate of return on investment assets during the year.
- Calculation: ROI = [I1 – (I0 + Savings)] / I0
- Assumptions: Savings are made in equal monthly deposits.
- This is an arithmetic return. Okay for 1-year periods. Geometric average is better over long term and more informationally useful to planner than arithmetic.
- Financial statements needed: balance sheets from 1-year ago and current.
- Benchmark: compare against same asset class. 8 to 10%.
- Return on Assets (ROA):
- Measures: a blended growth rate of all assets.
- Calculation: ROA = [A1 – (A0 + Savings)] / A0
- Considerations: use cautiously when client adding assets that are from debt. In this case, consider adding the net equity to year-end assets (A sub-1) to calculate.
- Benchmark: 2 to 4%.
- Return on Net Worth (RONW):
- Measures: growth rate of Net Worth.
- Calculation: RONW = [NW1 – (NW0 + Savings)] / NW0
- Benchmark: higher-the-better. Likely to become smaller as net worth increases.
- Return on Investments (ROI):
- Three performance ratios: Return on Investments, Return on Assets, and Return on Net Worth:
- Housing Ratio 1 = Housing Costs / Gross Pay <= 28%
- Housing Ratio 1 (Basic):
- Four kinds: Housing Ratio 1 (Basic), Housing Ratio 2 (Broad), Debt to Total Assets Ratio, and Net Worth to Total Assets Ratio.
- Hess Case Example
- See pages 93 to 98.
- The Two-Step/Three-Panel/Metrics Approach
- Two-Step Approach
- Two focuses:
- Covering risks – to avoid catastrophic losses.
- Savings & investments – as a path to financial security or independence.
- Covering risks – to avoid catastrophic losses.
- Three-Panel Approach:
- Refines the Two-Step approach by dividing the second step (savings & investments) into short and long-term objectives (and includes debt management in the Short-term.
- Panel 1 = Risk Management to determine adequacy of current coverage. Cover catastrophic risks.
- Life, Health, Disability, Long-Term Care, Property (Homeowner’s, Auto, & Other Property Insurance), and Liability Insurance.
- Panel 2 = Short-term savings and investments & debt management.
- Emergency fund.
- Proportion of income spent on housing (HR1 & HR2).
- Panel 3 = Long-Term Savings and Investments.
- Retirement goal:
- Savings rate.
- Investment Assets.
- Education funding goal.
- Any large purchase goal.
- Legacy goal:
- All need basic estate planning documents (will, durable power of attorney for health care, advance medical directive).
- Any financial legacy. (Even more savings would be required.)
- Retirement goal:
- Panel 1 = Risk Management to determine adequacy of current coverage. Cover catastrophic risks.
- Refines the Two-Step approach by dividing the second step (savings & investments) into short and long-term objectives (and includes debt management in the Short-term.
- Metrics approach:
- Uses quantitative example benchmarks for planner and client to use as guidance. Metrics organized by the Three-Panel Approach:
- Panel 1: Risk Management:
- Life = 12 to 16 times gross pay, if needed. Amount depends on surviving dependents needs.
- Health = Lifetime benefit >= $1M, though Section 2711 of Patient Protection and Affordable Care Act eliminated lifetime limits and are no longer a concern. Should be guaranteed renewable with reasonable out-of-pocket limits.
- Disability = 60 to 70% gross pay and at least guaranteed renewable. Covering both sickness and accident and a hybrid or own occupation definition and appropriate elimination period.
- LT Care insurance = If needed, daily or monthly benefits >= average for appropriate facility. Benefits-inflation adjusted and a benefit period >= 36 to 60 months.
- Homeowners: <= full replacement value on both dwelling and content and coverage for open perils.
- Auto: <= full fair market value for comprehensive and collision.
- Liability: at least a $1M personal liability policy. Need sufficient underlying homeowners and auto to satisfy PLUP issuer.
- Panel 2: ST Savings and Investing Goals
- Emergency fund: Equal to 3-6 months the monthly non–discretionary cash outflows. Should be coordinated with LT disability insurance elimination period.
- Housing: HR1 should be <=28% of gross pay. HR1 should decline to <=5% of gross pay at retirement.
- Housing & Debt: total paid for housing costs and other debt payments <=36% of gross pay. Other debt payments include, not limited to, credit cards, auto, & student loans.
- Panel 3: LT Savings and Investment Goals
- Financial Security (retirement): 10 to 13% of gross pay (including employer match). Have an appropriate amount of investment assets relative to gross pay for the client’s age.
- College Education Funding: save $3,000/$6,000 or $9,000 per child per year for 18 years in a balanced portfolio (60% stocks/40% fixed income). Savings depends on where child expected to attend (in state/mid-private/elite-private).
- Lump-Sum Goals: Goals like second home, airplane, or boat require savings of at least 20% of the total price as a down payment. This added goal will increase the overall savings rate required to achieve all the goals.
- Legacy Goals: every client under age 50 needs basic documents [will, curable power of attorney for healthcare, advanced medical directive (living will), and a durable power of attorney for financial matters.] Those 50 and over may also need trusts and estate planning.
- Panel 1: Risk Management:
- Uses quantitative example benchmarks for planner and client to use as guidance. Metrics organized by the Three-Panel Approach:
- Risk Tolerance and Asset Allocation:
- The Three-panel approach and metrics approach helpful framework. But still need tools to develop an investment plan.
- Asset allocation (AA) is generally accepted as the largest contributor to investment performance over time and the two key components of determining a proper AA are risk tolerance and time horizon.
- Risk tolerance is a combination of both ability and willingness to take on investment risk.
- Ability is dependent on time horizon, liquidity needs, tax conditions, and unique financial and personal circumstances.
- Willingness is dependent on the psychological condition. A risk tolerance questionnaire provides the planner & client a clear understanding of this.
- One questionnaire is the “Global Portfolio Allocation Scoring System (PASS), which considers both time horizon and risk tolerance to determine appropriate AA.
- First step is answer scored questions and add scores. The next step is determine the time horizon and use the AA under the client’s risk tolerance within that time horizon.
- One questionnaire is the “Global Portfolio Allocation Scoring System (PASS), which considers both time horizon and risk tolerance to determine appropriate AA.
- Risk tolerance is a combination of both ability and willingness to take on investment risk.
- Two focuses:
- The Present Value of Goals Approach
- Determines present value of each short, intermediate, and LT goal.
- Sums the PV’s together.
- Reduces by current resources (investment assets and cash and CE).
- Treats net PV as an obligation to be retired over remaining work life expectancy at a discount rate equal to the expected portfolio rate of return.
- The resultant can then be compared to current actual savings rate to see if current savings are adequate to pay for all goals.
- Presentation of the Present value of All Goals Approach
- Helpful to present values at various times and both the overall savings requirements and specific goal savings requirements.
- Helps to see the cost of each goal in terms of annual required savings to consider priorities.
- The Cash Flow Approach
- Takes the annual current I/S and adjusts the CF’s by forecasting what they would be after implementing all of the planning recommendations.
- Four categories of CF impact:
- No CF impact.
- Annual recurring positive or negative CF impact.
- One-time nonrecurring positive (sale of an asset) or negative (pay off debt) CF impact.
- A positive or negative impact, but doesn’t affect CF on I/S.
- Examples within three-panel approach :
- Risk management:
- No CF Impact: beneficiary name change, stop driving uninsured vehicle.
- Positive annual CF impact: raise deductible, eliminate duplicate coverage.
- Negative annual CF impact: lowering deductibles, purchasing insurance, increasing amount of current coverage.
- Debt Management:
- Debt characteristics:
- Good debt: tends to have 2 components: (1) interest rate is relatively low compared to expected inflation and expected investment returns, and (2) the expected repayment period is substantially less than the expected economic life of the asset. Examples: Home purchase with 15-year mortgage. Student loan with vocation (medical, law).
- Reasonable debt: competitive interest rates, typically long-lived economic life of asset purchased, repayment period is less than economic life of asset. Examples: Home purchase with 30-year mortgage. Student loan for general higher education. Car loan with repayment period of 4-5 years.
- Debt characteristics:
- Savings and Investing Management:
- Examples:
- Annual recurring positive or negative: increase 401(k) plan employee deferral.
- One-time nonrecurring: add to the emergency fund.
- Examples:
- Risk management:
- The Strategic Approach
- Characterized by a client’ s mission statement, a set of goals, and a set of objectives.
- From the mission statement, a needs-driven list of goals is created. From those goals, a detailed list of objectives is created.
- Planner creates a plan from reviewing internal and external data and creates a long-term plan (mission) with short and intermediate accomplishments of goals and objectives.
- The plan incorporates capitalizing on client’s strengths, overcoming weaknesses, taking advantage of external opportunities and mitigating external threats (SWOT).
- Needs versus wants are considered.
- Characterized by a client’ s mission statement, a set of goals, and a set of objectives.
- Two-Step Approach
- The Two-Step/Three-Panel/Metrics Approach
- See pages 93 to 98.